Analysis (📊)
What your data is telling you — the answer first, the details after. The methods behind the numbers are covered in the Calculations chapter.
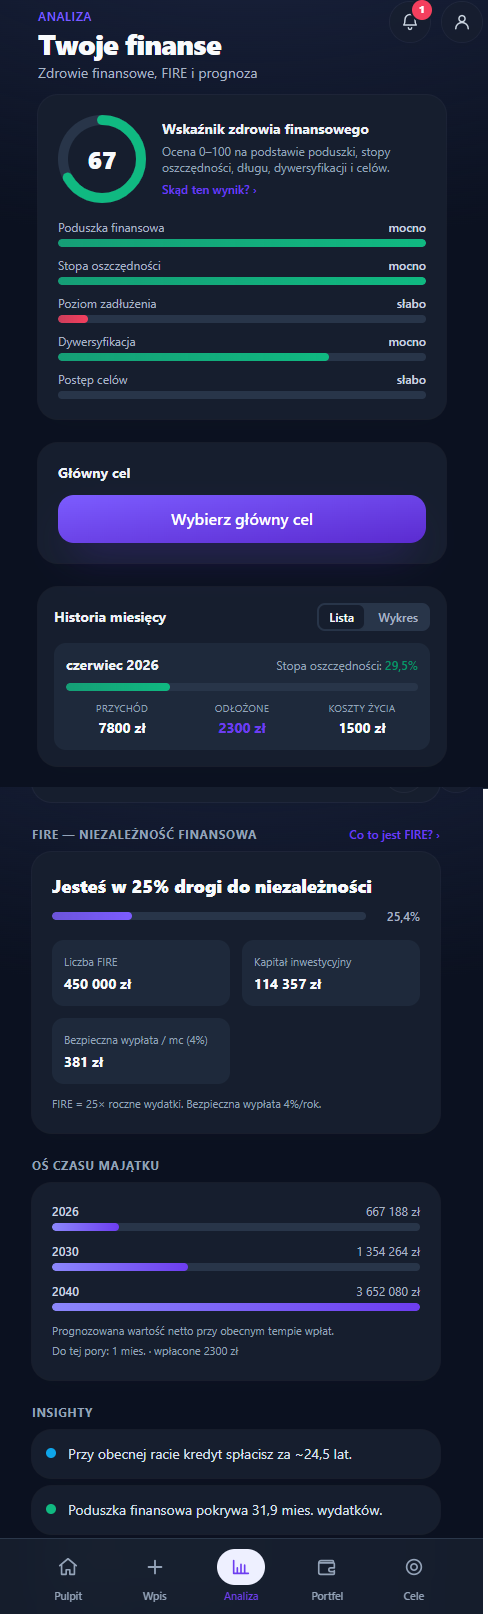
The screen has three tabs: Health, FIRE and History — plain words without icons, so they fit in full on a narrow phone. The remaining takeaways sit at the bottom of Health (the old "Takeaways" tab usually held two rows, so it didn't earn a place of its own). You edit the main goal on the Dashboard.
The FIRE tab (with Monte Carlo), the health score with the list of other takeaways, and the two return figures (Your return and Market return) are modules — turn them on in Settings → App view ("FIRE & simulations", "Financial health & takeaways", "Investment details"). With the core only, Analysis shows the net worth change, health, total gain and the month history.
Links to tabs
Every tab has its own address, so a link or a page refresh brings you back to the same place:
| Address | Opens |
|---|---|
/insights?tab=health | Health |
/insights?tab=health#score | Health, scrolled to the health score |
/insights?tab=health#insights | Health, scrolled to the other takeaways |
/insights?tab=future | FIRE |
/insights?tab=future#fire-assumptions | FIRE, scrolled to the assumptions (SWR, expenses, age) |
/insights?tab=history | History |
The old address /insights?tab=insights (the former "Takeaways" tab) still
works — it redirects to /insights?tab=health#insights. Other screens use these
addresses: the Financial health tile on the Dashboard opens the health
score, and a notification about a takeaway opens the place
where that takeaway lives. When the address points to the tab of a module that
is off, Analysis opens Health.
Health
Health answers a question no other screen asks: what changed your net worth over the last 12 months? The Dashboard shows the current month — Analysis looks at the whole year. The tab looks the same in Simple and Full mode (the health score and other takeaways come with the Health module).
-
Net worth change over 12 months — an answer title, e.g. "Over 12 months, net worth grew by 141,339 zł", the period (e.g. "Nov 2025 – Oct 2026" — the months the contributions and repayments come from) and parts that add up to exactly that amount:
- Contributions — the sum of contributions from monthly entries to accounts and investments,
- Principal repaid — how much loan balances fell (instalments and overpayments),
- New and closed loans — only when a new loan appeared in the period (its balance with a "−" sign) or a loan left the portfolio ("+"). Borrowed money is not a market result, so we don't hide it in the last part,
- Valuations and FX — the rest of the change: prices, interest, asset valuations.
Each part shows a signed amount and a proportion bar; a fall in valuations carries a "−" sign, not a red colour. Contributions are violet, principal repaid light violet (repaying also builds wealth), market teal — amber is reserved for living costs. These are the same numbers and the same rounding as "Where did this growth come from?" on the Dashboard — the parts always add up to the title.
Couples. When both adults have their own contributions, a split appears under the parts: "Contributions by person: Kuba +36,000 zł · Ania +16,200 zł · joint +43,200 zł". Joint means accounts without an owner; the three amounts add up to the "Contributions" part. Month by month takes you to History. With a shorter history the window is shorter (e.g. "Over 5 months"), and before the second entry the card says the breakdown will appear after it.
-
The "what now and are we safe" card — one card instead of three. The tab has a single heading — the net worth change from point 1; the takeaway in this card is its subheading (smaller and lighter), not a second heading:
- at the top, the most important takeaway with the next step (in the demo: "Your cushion covers 6.7 months of expenses." and "The cushion is full — further surpluses go to dated goals first." with an Open Goals › link). Analysis doesn't show goal shortfall amounts — that's the job of the Goals screen. When the takeaway is about the buffer, savings or debt, the card gives only the step — the number is in the line below;
- below it, three safety facts side by side (stacked on a phone) — each with a label, a number and one sentence of context: Cushion 6.7 mo., You put aside 48.1% of income (last 12 months), Debt 43.7% of assets — typical with a mortgage. When the takeaway already talks about the cushion, the card doesn't add a second sentence about its level. Below the facts (on a phone — right under the cushion, before savings and debt) you can see where the cushion months come from: "57,953 zł (COI bonds) ÷ 8,587 zł spending/mo (incl. loan payments, average of 12 mo.)" — the pool, the names of the accounts counted towards it, and average monthly spending including loan instalments over the last 12 months with income. Instalments still fall due when income stops, so the cushion says how many months you would really last. Change what counts towards the cushion opens Portfolio. The full card with these facts is on the Dashboard and calculates the same way;
- with the Health module — the health score (described below).
-
Return on investment — in Full mode below the card from point 2, full width (the card with the score is tall and the facts need the room). In Simple mode the return is a single figure, so on a wide screen it sits next to the card from point 2 (two thirds and one third of the width) — no card with one amount stretched across the whole screen.
-
Other takeaways (Health module) — at the very bottom, described below.
How the most important takeaway is chosen: items that need attention first (e.g. high debt together with a large volatile share, a thin buffer, a falling savings rate), then information with a concrete step, then praise, and plain facts last (debt share in a typical range, loan payoff date, % of the way to FIRE).
A shortfall on dated goals. When your dated goals need more each month than you put aside, Analysis doesn't show the amount — that number lives only in Goals (the 2026-10-14 review found the same amount on three screens). Analysis still accounts for the gap: with a full cushion it doesn't suggest that "further surpluses can go to work in investments"; it says "dated goals first" and links Open Goals ›.
Every amount in Analysis uses a thousands separator, four-digit amounts included ("4 283 zł", not "4283 zł").
An empty plan. Until the plan has any account, asset or entry, Health shows no facts that don't exist ("Debt: none", "Cushion 0 zł"). Instead there is a single card with an Add your first account button.
Health score (0–100)
With the "Financial health & takeaways" module the score sits in the card from point 2 as one compact row: the label Health score, the number (82/100 in the demo), a line that lists every area by status — "3 of 5 areas strong: cushion, savings, diversification · medium: goals · debt: typical with a mortgage" — and the Where does this score come from? link. The numbers for individual areas (e.g. diversification, goal progress) live in that sheet, not in the card — the Health card used to have about ten elements.
Goal progress is a sum: saved ÷ the amounts of all goals in progress (completed ones excluded), just like the header in Goals. In the demo: "125,000 zł of 308,000 zł · 40%". The score used to average the percentages of individual goals (51%), so Analysis and Goals showed different numbers. When every goal is completed, the component is 100%.
Positions are named as in Portfolio ("Global ETF"), not by ticker ("SWRD"). The share of the largest holding is measured among investments, not total wealth.
Where does this score come from? opens a sheet with every component — buffer, savings rate, debt level, diversification, goals — with each weight (with complete data 29 / 23 / 18 / 18 / 12%; the weights always add up to 100%, also when an area is missing), your number and a tip calculated from your data, e.g. "About 8,400 zł short of 6 months" or "Above the 6-month target — nothing to add here". An ordinary mortgage is never labelled "weak" — it reads "typical with a mortgage", because it is scored more gently than consumer credit (details in Calculations).
Without data there is no score — you won't get "100" just for having no debt. Debt with no assets at all is the weakest level, not "no debt".
Return on investment
- Total gain — today's value of your investments minus the capital you put in, with the percentage of contributions next to it (e.g. "+11.5% vs contributions").
- Annual return ("Investment details" module) — with a unit, e.g. "+7.7%/yr".
The annual return is calculated two ways: money-weighted (XIRR — accounts for how much you paid in and when) and time-weighted (TWR — how the investments themselves performed). When the two differ by more than 0.5 percentage points, both figures are shown — Your return (with contributions) and Market return — with a sentence on how they differ. When they are practically equal (normal with regular, similar contributions), one figure remains, without an extra sentence about contribution dates — one figure needs no lecture. The How we calculate the return sheet describes what the card shows: with one figure — one method and why the other adds nothing; with two — both. It also holds the "contributed → value today → gain" breakdown. Both need a few months of history (before that you see "—").
Next step for a goals gap
Moving a deadline so the plan fits (e.g. "Move "House build" to November 2028 · ~7,200 PLN/mo → about 400 PLN/mo left") is offered by the verdict in Goals. Analysis only links there with Open Goals ›.
The health score is a single row in the card (the number and How is this score calculated? ›). The list of areas ("3 of 5 areas strong: …") sits at the top of that sheet.
On wide screens (from 1280 px) the Topics to review card in the right column shows, besides overdue entries and maturities, the goals gap (linking to Goals) or a warning that leads Analysis. "Nothing urgent" appears only when none of these applies.
Other takeaways
At the bottom of Health (Health module) sit the remaining takeaways: without
the one that heads the card and without the facts the card already shows in the
safety facts (cushion, savings rate, debt share). With the FIRE module on,
"Progress to FIRE" is not repeated here either — the FIRE tab shows it. When
the takeaways differ in weight, each carries it in words — Needs attention,
Info or Good — so you don't have to read it from a colour. When they are
all plain information, the labels disappear (the same label on every row says
nothing); "Needs attention" always stays. The loan payoff date is given as a year and in whole
years ("At your current repayments the loan will be paid off around 2051 — in about
25 years.") — a fraction of a year on a multi-decade loan is false precision. It's
the same schedule as on the Dashboard, in Goals and in FIRE; when the year from the
instalment falls after the end of the contract, the takeaway states both dates and
asks you to check the instalment and the term.
Positions are named as in Portfolio. The same rules power your
notifications; a notification about such a takeaway opens
/insights?tab=health#insights.
Monthly history
History has its own answer — the monthly rhythm — instead of repeating the 12-month sentence from Health. When you set aside a similar amount every month (within 5% of the average), the card says e.g. "Every month you set aside 7,950 zł — the same for 12 months"; when amounts vary — the average and the range ("… 6,200 zł on average — from 4,000 zł to 9,000 zł"). Below: the net worth change over the period ("Net worth: +128,835 zł in 12 months") and the savings rate over the months in the table (e.g. "last 12 months"). The same rate appears in the Total row. Health uses the same 12 months, so the whole screen shows one rate (Health used to take 6 months, and 49.6% stood next to 48.1%).
- List is a table: month, saved, that month's rate and net worth change vs the previous month. On wider screens income, loan payments and living costs are added, so the arithmetic adds up: income − saved − loan payments = living costs (footnote under the table). On a phone those three columns are hidden but still reachable: tapping a month expands "Income 15,955 zł · Loan payments 3,804 zł · Living costs 4,201 zł" under the row.
- Rounding. Income, saved and loan payments are each rounded to whole złoty, and living costs are derived from those rounded amounts — so every row adds up (15,955 − 7,950 − 3,804 = 4,201, the same as on the Dashboard) and the instalment has the same value every month. The Total row is the sum of the displayed rows. Whole columns used to be rounded "to the total": the total matched, but a row didn't (4,202 instead of 4,201, and the instalment was 3,804 zł one month and 3,803 zł another). The 12-month living-cost total is the same amount FIRE uses as annual expenses (57,392 zł in the demo).
- The last 12 months are shown by default; Show all months expands the full history (the title, the rate and the total then cover the whole period).
- Chart has an answer title, e.g. "On average you save 7,950 zł of 16,537 zł income a month" (averages over the months on the chart), with a caption below saying what the bars draw: income, saved, loan payments and living costs. The last three add up to income — without loan payments every month was short by the instalment. The axis uses round ticks (0 / 5k / 10k / 15k…).
With no entries History is not blank: it says the history starts with the first entry and links to the Entry screen with Add an entry.
Net worth change comes from monthly net-worth snapshots — it includes contributions, market results and debt repayment. When there are no snapshots yet (e.g. right after an import), the title only states how much was saved and the change column shows "—". Green and red appear only for a change in value.
FIRE
Calculated from the investment lens (accounts + cash + rental — your car and the home you live in don't fund retirement). The lens leaves out money set aside for someone else — positions and assets with a beneficiary, e.g. a child's 800+ bonds. That isn't capital the couple will live on, so it counts neither towards the FIRE portfolio nor towards the contribution pace. The same lens drives the For freedom view in Portfolio, so those positions aren't there either. FIRE used to count Zosia's bonds (25,750 zł) and her 800 zł/mo as the parents' own portfolio.
That is why the FIRE portfolio differs from the total net worth on the Dashboard. The answer card says it in numbers inside the collapsible Where do these numbers come from? (see below): "Why the numbers differ: the FIRE portfolio 405,118 zł is investments 385,118 zł plus cash or rentals 20,000 zł. Net worth 737,326 zł adds 875,750 zł outside FIRE and subtracts loans of 543,542 zł. Money set aside for someone else isn't counted: Obligacje 800+ dziecka (Zosia, 25,750 zł)."
On a wide screen the answer and assumptions sit on the left, the freedom levels and the FIRE portfolio timeline on the right. On a phone — one column: answer, levels, assumptions, simulations, timeline.
The answer comes first. The first card is one sentence about the whole household. Ages come from each adult's date of birth (Settings → people in the household); for the main person the date from their profile also works.
- when both people have a date of birth — "… around 2038 (Kuba 46 · Ania 48)",
- when a couple has only one date — "… around 2038 (Kuba at 46)" and an Add it in Settings link that opens the date field of the person whose date is missing,
- without dates — the year and the number of years, with the right form: "(in 1 year)", "(in 2 years)" (Polish used to show the "many" form for every number, e.g. "za 2 lat").
Below it: a progress bar, the portfolio against the freedom number (in today's money — the freedom number comes from current spending), the contribution pace (how much goes into the FIRE portfolio each month) and "If you went FIRE today" — what the current portfolio would pay per month at the chosen SWR, with the note "before repaying the loan (543,542 zł today)", because a withdrawal from the portfolio doesn't repay the loan by itself. When the goal is more than 100 years away at the current pace, the sentence says so plainly and suggests what shortens the path.
Dated goals paid from the same money. When a dated goal (still before its date) uses an account or asset from the FIRE portfolio as its source — chosen in the goal or written in its description, e.g. "Inwestycje ETF + gotówka" — a sentence stands under the answer: "“Budowa domu” (2027) will take about 180,000 zł of this money — FIRE doesn't subtract it yet." The amount is the missing part of the goal (amount − saved). The answer year and the FIRE number don't account for this withdrawal yet — the sentence says so plainly instead of pretending the money stays in the portfolio.
Where do these numbers come from? is one collapsible place (closed by default) for everything that explains the numbers in the answer: how the FIRE number is built (see below), "Why the numbers differ" (FIRE portfolio vs net worth, with money set aside for others), what the "FIRE portfolio over time" axis shows, and what FIRE leaves out. These used to be four separate small-print paragraphs under the answer and under the timeline.
-
Freedom levels — Coast FIRE, Lean, Full and Fat with progress and a short inline explanation (Lean = 70% of current spending, Fat = 150%). Coast FIRE is the capital that will grow to the retirement target by the given age without further contributions — the easiest threshold, not freedom. A level you have reached is labelled "reached", not just ticked.
-
Assumptions (recalculated live; direct link:
/insights?tab=future#fire-assumptions). Next to the title stands the answer — "Answer: around 2038" — and after you change an assumption, the year before the change too, e.g. "Answer: 2038 → 2036" (compared with the year when you opened the tab). On a wide screen the assumptions sit under the answer, so without this line the effect of changing the SWR or the return was invisible:- Safe withdrawal rate (SWR) — 3 / 3.5 / 4%, with one sentence on what it means;
- Real return until FIRE — 3 / 5 / 7% a year above inflation (5% by default), with one sentence: 3% cautious, 5% moderate for stocks and bonds, 7% optimistic. It changes the answer year, the timeline, Coast FIRE and the simulations. The note used to say you set the rates yourself, although there was no field for it;
- Annual expenses — with a thousands separator and a "zł/yr" unit. By default these are living costs over the last 12 months — the same amount as the living-cost total in History (a note under the field says so). If you type your own amount, "From entries: 57,392 zł · restore" appears below the field — one click returns to the value calculated from your entries. Your own amount counts everywhere FIRE appears: in the tab, in the "You are X% of the way to FIRE" insight and in the notification about reaching 100% — all three use the same calculation and the same settings (an SWR outside 0–20%, e.g. from a damaged backup, falls back to the default 3.5% in each of them). Previously the insight and the notification always took expenses from entries, so they could show a different percentage than the tab;
- Retirement age (Coast FIRE) — used only for the Coast threshold;
- fixed post-FIRE income (state pension, rental, part-time), which lowers the freedom number.
An unreadable value doesn't silently disappear: the field keeps what you typed and shows "Enter an amount greater than zero.".
-
Simulations & taxes — collapsed by default. Random market scenarios (Monte Carlo: 400 paths with a random yearly return, the same seed every time) answer "when", not "whether". The answer year comes from the average return, so by definition it falls roughly in the middle of the scenarios — the card says so plainly: "around 2038 — in half of the scenarios" and "more certain (3 in 4): 2040" — the year by which three in four paths reach the target. Both years come from the same 400 paths, and the target on each path is that year's target (expenses ÷ SWR + that year's loan balance), just like the answer. Shares are rounded to 5% — 400 draws don't give "48.3%" precision. The card used to show "Chance of success: low (48.3%)" for the headline year, which read like a warning although it is simply the middle of the distribution. When your retirement age falls later than the answer year, a second line covers the longer horizon: "Over a horizon to age 60 (retirement age in your assumptions): over 95%". Next to it: the effective after-tax SWR (IKE 0 / IKZE 10% / regular 19%) and how many months sooner you'd reach the goal by adding 500 zł a month ("+500 zł/mo → target about 5 months sooner"). That comparison uses the same moving target as the answer (each month's loan balance) in monthly steps — hence "about".
-
FIRE terms — explained: every concept (FIRE, Coast, Lean/Full/Fat, SWR, freedom number) with a definition and a figure calculated from your own data. The sheet closes with a Got it button, like the other sheets in Analysis.
"Contribution pace" counts only investment contributions and overpayments on a buy-to-let loan — the instalment on the home you live in does not grow the FIRE portfolio. This is an educational tool, not investment advice — you enter the assumptions yourself. Formulas: How we calculate.
One name for the target: the freedom number
The FIRE target has one name across the tab — the freedom number (also in the formula under "Where do these numbers come from?"). Progress is shown in whole percent, rounded down, as in Goals and on the Dashboard (19%, not 19.9%). While you repay a loan, the freedom number falls every year, so the answer says so: "The target shrinks as you repay the loan — in 2038: 2,031,036 PLN". Timeline rows show the target for their year ("target in 2030: …"), and the timeline title is an answer ("The portfolio reaches the target around 2038").
Under Contribution pace a line explains the difference from History: the FIRE pace is the contribution plan without money set aside for other people (e.g. "7,950 PLN from the contribution plan − 800 PLN set aside for: Zosia"). For couples, Coast FIRE and the simulation horizon name whose age they use (the main person, e.g. "retirement at 60 (Kuba)").
On phones the Assumptions are collapsed behind Change assumptions; the
live answer ("Answer: about 2038") stays visible. The #fire-assumptions link
(e.g. from Goals) opens them straight away. From 1024 px they are always open.
The FIRE number and your loan
FIRE annual expenses are living costs without loan instalments — after FIRE there is no instalment any more. The loan can't simply be ignored, though: the balance still left in the FIRE year has to be repaid from the portfolio. So FIRE number = expenses ÷ SWR + loan balance to repay in the FIRE year, and the answer year is the first year in which the portfolio covers both parts. The balance in a given year follows one debt schedule — the instalment and the average actual overpayment over the last 12 entries — the same one the Dashboard and Goals use for the payoff year. The planned overpayment from Portfolio only counts when there are no entries yet. FIRE used to always take the plan (4,000 zł/mo), and in the demo it "repaid" the loan before 2035 although the entries had no overpayment at all — the FIRE target then left out about 400k zł of debt.
The calculation is shown in Where do these numbers come from?, e.g. "FIRE number = expenses 57,392 zł ÷ 3.5% + loan balance left to repay in 2038: 391,264 zł = 2,031,036 zł" (demo data). When the loan is gone before the FIRE year, the sentence says so instead of adding "+ 0 zł": "Kredyt hipoteczny: at your current repayments the balance reaches zero before 2030, so it doesn't raise the target". The Lean / Full / Fat levels also add the loan balance (the debt has to be repaid whatever your lifestyle), but each from the year that level is reached: Lean comes earlier, so it adds a higher balance; Fat comes later and adds a lower one. All three used to take the balance from the Full FIRE year. The Coast threshold takes the balance in the year you reach retirement age. A loan linked to a buy-to-let home already reduces the FIRE portfolio, so we don't count it twice.
FIRE portfolio over time
The timeline in the FIRE tab calculates exactly what the answer calculates: the investment portfolio, the real return from the assumptions (e.g. 5% a year), the current contribution pace, amounts in today's money. So the timeline cannot show the goal being crossed earlier than the year in the answer — that year has its own row marked "goal reached", and a vertical tick on every bar shows the target for that year (expenses ÷ SWR + that year's loan balance) — as the loan shrinks, the tick moves left.
Under the card title there is one supporting sentence, e.g. "In 14 years: about 2.48 M zł in today's money" — plain text, because the tab's answer is the FIRE year in the first card. Rows are labelled with the interval (Today, In 4 years, In 12 years, In 14 years) and the year, because the intervals are uneven. Each row has two lines — the interval and year, then "portfolio X · target Y" — and neither breaks in the middle (the FIRE-year row with "goal reached" used to wrap differently from the others). What the axis shows and what FIRE leaves out, e.g. "Excluded: Mieszkanie, Działka pod dom (850,000 zł) — they don't count towards FIRE. Kredyt hipoteczny (543,542 zł today) doesn't reduce the portfolio — its balance in the FIRE year is added to the freedom number.", are in Where do these numbers come from? in the answer card. This place used to hold a projection of total net worth (home included, nominal) — it crossed the freedom number several years before the year in the answer and gave two conflicting answers on one screen.