Portfolio (💼)
Full configuration of your wealth.
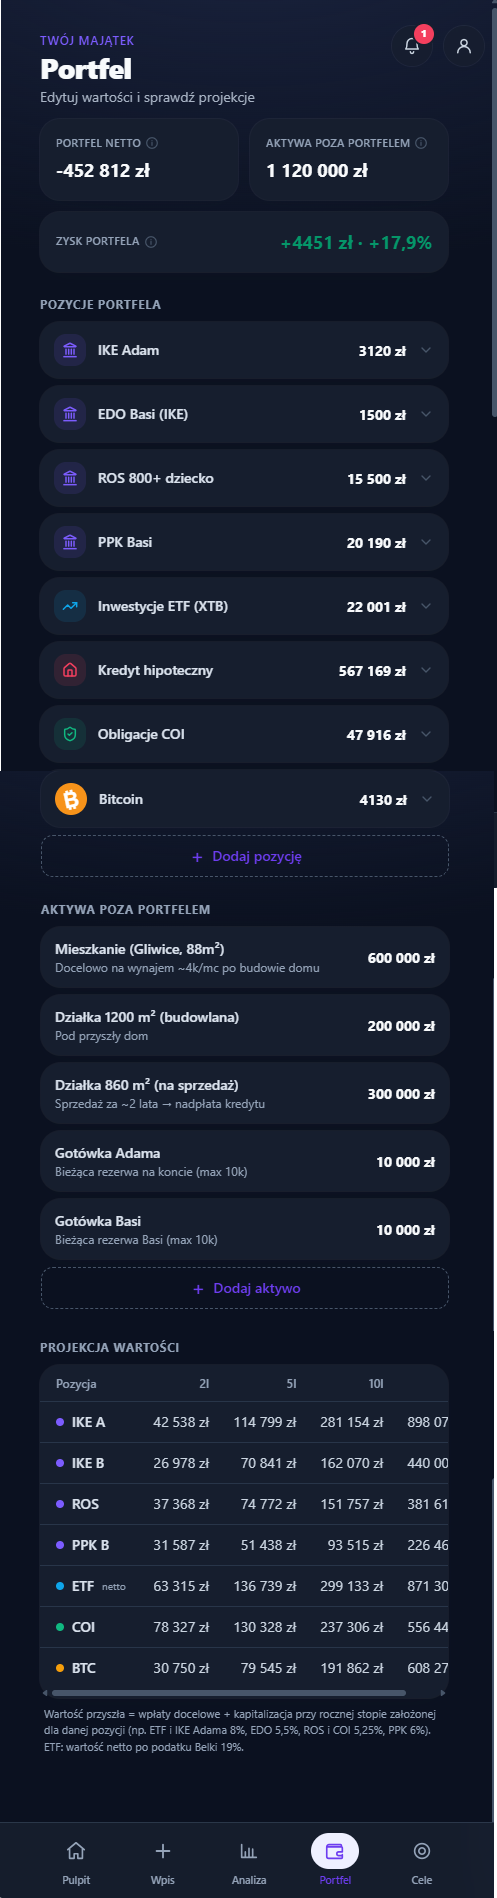
Summary and view
The Portfolio is for managing your wealth: this is where you edit values, add accounts and things, and look at the projection. The big net-worth figure belongs to the Dashboard, so the top of the Portfolio is a single compact card:
- the wealth amount (net worth by default); clicking it explains how we calculate it (investments + non-investment assets − debt),
- the gain on investments, labelled explicitly, e.g. "▲ +42,243 zł gain on investments · +8.2%". It's the result of accounts where you entered the invested capital (value minus contributions), not the change in your whole wealth. The gain counts what you see below: with a view other than "Everything" it covers only those items and reads "in this view", e.g. "+27,584 zł gain in this view"; with only a person selected it carries that person's name, e.g. "Kuba: +24,488 zł gain". Positions without a known invested amount (e.g. crypto added offline, see below) are left out of the gain,
- the View switch, which changes the amount above.
The View decides what counts toward the amount (the label changes from "Net worth" to "Wealth for freedom" or "Money at hand"):
- Everything: everything minus loans and other debts (the same as on the Dashboard).
- For freedom: what works toward financial freedom: investment accounts, cash and rental property. Excludes physical assets (car, equipment) and the home you live in, because these don't fund retirement. FIRE is calculated from this view.
- At hand: money available within days, i.e. cash and investments outside retirement accounts (IKE/IKZE/PPK), including savings bonds (early redemption costs a fee), crypto and gold. Excludes property and belongings.
In the code and in the calculations this switch is called the "lens"; in the app it's simply the "View".
On a computer the switch is followed by a bar showing the share of each wealth class, captioned "Gross breakdown — before subtracting loans" (the amount above is net). The bar uses neutral greys rather than category colours: the sky blue of cash read like Investments on the Dashboard, and the teal of property like Savings. The legend says what is what, with full names (e.g. "Investment accounts", no abbreviations). Legend amounts are always in thousands, e.g. "20 tys. zł" and "850 tys. zł", so they compare at a glance. On a phone the bar is hidden: the balance-sheet groups below show the same composition, and the card stays short so the first item is near the top.
The view also applies to the list, and every amount says the same thing. In the "For freedom" or "At hand" view, the amount in the summary, the "What we own" total and the sum of the rows in the view are equal:
- "What we own" and each group show the amount in the view and the whole, e.g. "271,684 zł of 1,280,543 zł",
- groups that sit entirely outside the view (e.g. retirement accounts in "At hand") no longer get their own "0 zł of 850,000 zł" header. One line under the list reads "Outside this view: Retirement accounts 158,859 zł · Property 850,000 zł · Loans −543,542 zł"; clicking it expands those groups with dimmed rows. Loans join that line when none of them is in the view, so there's no "0 zł of −543,542 zł" header either,
- rows outside the view sit at the end of their group, collapsed into one line, e.g. "4 items outside this view · 158,859 zł". Clicking it expands them: the rows are then dimmed with grey text (with WCAG AA contrast, not transparency) and labelled "outside this view",
- instead of the net worth equation, the line under the list gives the result of the view, e.g. "At hand: 271,684 zł of 1,280,543 zł". When the "For freedom" view includes a loan linked to a rental flat, the line reads "For freedom: what we own − loan = result", matching the amount in the summary.
Clicking the amount in the summary opens the breakdown of the same view: the same items and the same total, not always the full net worth. In the "Everything" view nothing is collapsed and the totals have no "of …".
The net worth breakdown is laid out in the balance-sheet groups (Retirement accounts, Funds and stocks … Cash and other, then Loans), with a subtotal per group and an icon on every row, including the flat or cash. Previously rows came in the order they were added and assets had no icons. Screen readers hear what the amount and gain buttons do, e.g. "Net worth 737,002 zł — show breakdown" and "+42,244 zł gain on investments · +8.2% — show details".
The view is a segmented control inside the summary card, deliberately different from the violet "Whose:" chips below, because it does something different. The projection (the "Projection" module) no longer has its own tab bar above the card: inside the card, next to the view description, there's a secondary link "Projection and maturities →", and on the projection screen "← Balance sheet" takes you back. The projection screen has no view switch (it applies to the balance sheet) and the card shows the household's net worth there.
Balance sheet: what we own and what we owe
Accounts, instruments, property, cash and loans sit on one list laid out like a balance sheet. They used to be two tabs, "Positions" and "Assets", which mirrored how the data is stored rather than how a couple thinks about money. The data model hasn't changed (positions and assets are still stored separately); only the presentation has.
What we own (solo plan: "What I own") has a total and groups, each with its own subtotal:
- Retirement accounts: accounts with a withdrawal age (IKE, IKZE, PPK, PPE, OIPE, and elsewhere e.g. Riester, SIPP, 401(k)), whatever they hold,
- Funds and stocks: ETFs, stocks and funds outside retirement accounts,
- Government bonds: retail treasury bonds outside IKE/IKZE (including the family 800+ bonds),
- Crypto and precious metals,
- Property: flat, house, land,
- Cash and other: cash, bank accounts and deposits, plus things (car, equipment, collections).
The group comes from the account type and instrument, not from the category you set yourself. Categories still drive the Dashboard and the monthly entry. That's why the groups have names different from the default categories ("Funds and stocks", "Government bonds", "Retirement accounts", "Crypto and precious metals"): the same name on the Dashboard and in the Portfolio with different amounts looked like a bug. In the sample plan the Dashboard's "Bonds" category and the "Government bonds" group have the same total. Within a group, rows are ordered from the largest value. Manual reordering is gone: with grouping it's no longer needed.
What we owe (solo plan: "What I owe") lists loans and leases with a total. The total in the header carries a minus sign, like the loan rows below it (e.g. "−543,542 zł"). Debt is shown neutrally: it's a balance, not a fall in value, so it isn't red.
Closing the balance. Below the list there's a line "Net worth = What we own − What we owe" with both amounts and the answer, e.g. "1,280,543 zł − 543,542 zł = 737,001 zł — that's what you're worth together" (solo plan: "that's the net worth"). With a person selected the line ends "that's Ania's net worth" (with a 50/50 split: "…, with half of what's shared"), and with "Joint" "that's what you own together". While you search the line is hidden: search results aren't a balance sheet, and an equation built from the matches alone ("Net worth = … 106,980 zł") was misleading. In a view other than "Everything" the line describes the view (see above).
Who owns what (couple's plan). Above the balance sheet are violet chips labelled Whose: — Everything / Kuba / Ania / Joint — in a single row that scrolls sideways on a narrow screen. The "Whose:" label stays put (only the chips scroll). When the chips don't fit, the right edge of the row fades out, so you can tell there's more; when they all fit (or the row is scrolled to the end) there's no fade — previously it was always on and clipped "Joint". The chips carry no amounts and have a full 44 px touch target. It's the same filter as the person switcher on the Dashboard — the choice carries over between the screens for the rest of the session. Picking a person changes everything at once, by one rule, the same as the person view on the Dashboard:
- the list shows that person's items plus joint items (without an owner),
- with a 50/50 split (Settings → Profile) joint items count half for the person: the row shows half the amount and is marked "½ shared". This includes a joint loan, so "What we owe" shows half the balance. Both people's net worth then adds up exactly to the household's, to the złoty, also after rounding. When a joint amount is odd, one person gets the half rounded up and the other the half rounded down, alternating item by item (previously both ",50 zł" halves rounded up and Kuba + Ania came out one złoty above the total). The person view on the Dashboard uses the same split, so a person's amount is identical on both screens. The ⓘ next to the chips explains the rule,
- with "full to each" joint items count in full (no ½ mark),
- the summary card shows that person's net worth, labelled e.g. "Net worth · Ania 337,335 zł" with "of 737,001 zł in total"; the gain and the balance line at the bottom use the same slice, so all three amounts agree,
- the details of a joint item (a loan too) say at the top that the row showed a part: "Kuba · ½ of joint: 41,735 zł of 83,470 zł". The rest of the sheet describes the whole item (balance, quantity, schedule), as it's stored.
"Joint" shows only items without an owner, at full value. When something is saved up for someone (a beneficiary, usually a child), the row has a "for: Zosia" subline.
A loan next to what it finances. When a loan is linked to an asset, the flat's row reads e.g. "loan −543,542 zł · equity 56,458 zł", and the loan's row under "What we owe" says what it's linked to. The equity line wraps on narrow screens and is never cut off.
Every row looks the same, whether it's an account or a flat: icon, name, a subline (in a couple's plan whose it is: Kuba, Ania or "Joint"; account type; units, e.g. "12 CSPX"), the amount and a chevron showing that the row opens details. A savings bond's icon uses the colour and glyph of the "Government bonds" group even when the position has another category (e.g. a child's 800+ bonds filed under "Retirement") — the 800+ row used to show the retirement-account icon. An IKE holding bonds stays a retirement account. For investments with known capital, the result sits under the amount (e.g. "+1,500 zł · +12.5%", green for a gain, red for a loss). The list and the table show the result in the same format, with a sign on both the amount and the percentage. With a keyboard, a row's focus ring is drawn inside the card, so the card's edge doesn't cut it off.
List header. Above the balance sheet there's the live ETF/stock price status with a "Refresh" button (only when the portfolio has items with a live price). With more than three positions and assets, the "What we own" header has a "Search the portfolio" magnifier. It opens a search field (name, ticker, account type or asset note) above the list; the permanent field is gone because it pushed the first item down. When nothing matches, the message has two buttons: "Clear" (back to the full list) and "Add" (opens the catalogue).
Adding. Below the balance sheet there is a single "Add" button. It opens the "What to add to the portfolio?" catalogue in the same right-hand sheet as details and editing. The catalogue has the same groups as the balance sheet: Retirement accounts, Funds and stocks, Government bonds, Crypto and precious metals, Property, Cash and other, and Loans. A flat, land, a car and cash are ordinary tiles next to IKE and ETFs; you don't need to know whether something is a "position" or an "asset". Each balance-sheet group header has a "+" that opens the catalogue narrowed to that group ("Show all" removes the filter).
At the top of the catalogue there's a "Search the catalog" field (case and Polish diacritics don't matter: "zloto" finds "Złoto / metale"). Matching starts at the beginning of words, so "zlo" also finds gold and "loan mort" finds the loan, but a fragment from the middle of a word isn't enough: "ike" finds IKE, not the vehicle (via "motorbike"). The catalogue also knows the everyday words for things: "car" or "samochód" finds "Vehicle", "flat", "house" or "mieszkanie" finds "Real estate", "mortgage" or "hipoteka" finds "Loan", "pension" or "emerytura" finds IKE, IKZE, PPK and PPE (Polish, English and German words). It's followed by a pinned Most common group: cash, IKE, ETF, savings account, loan and property (only those available in the selected country). When nothing matches, the catalogue offers a custom position or a custom asset: "Other account / investment" (something you pay into and that grows) and "Other thing (car, gear…)" (something with a value, no contributions). On a phone the tiles are in a single column so names fit in full; on wider screens there are two columns and long words break with a hyphen, not mid-word. Ethereum has its own Ξ mark (not the Bitcoin sign), and a vehicle as an asset is no longer in the pink debt colour.
Whose is it? In a couple's plan the add form starts with a Whose: Joint / Kuba / Ania switch (names from the profile; a solo plan doesn't have it). It defaults to the active "Whose:" chip on the balance sheet: with the "Kuba" chip the new item is Kuba's, with "Everything" or "Joint" it's joint. Previously everything you added was joint, even with a person selected. Personal accounts — IKE, IKZE, PPK, PPE, OIPE, and elsewhere Riester, Rürup, bAV, ISA, LISA, SIPP, 401(k), IRA, HSA, PEA, PER and Livret A — legally have one owner, so they don't offer "Joint". They default to the person on the active chip, or, when the chip isn't a person, to the person using this device (Settings → who uses this device). When that's unknown, nobody is preselected and saving asks: "Choose whose account this is.". A short note under the switch explains why, e.g. "IKE has exactly one owner — it can't be joint.". You can change the owner later in the editor.
Adding and editing use the same fields. The position editor has the same Whose switch as the add form (with the same rule: IKE, IKZE, PPK and other personal accounts have no "Joint"; an old joint IKE asks you to pick a person when saving), the same field names and the same order — units come before the ticker. In Simple mode neither form shows "Expected return" or "Goal"; the projection then uses the typical assumption for that account. A new personal account in a couple's plan is named after its owner, e.g. "IKE Kuba" (you can change it in the "Name" field).
Monthly contribution is the one name for the amount you add every month — in the add form, the editor and the details (previously "Target contribution", "Buy plan (DCA)" or "Contribution"). The template's suggestion (e.g. "e.g. 1,000 zł") is only a hint in an empty field — an empty field means 0 a month, so adding an account no longer quietly raises the monthly plan on the Dashboard. The same goes for the expected return in Full mode: an empty field means the template's typical assumption, shown as a hint.
Positions valued from quantity (crypto, gold and other metals, ETFs with a quote symbol) have no "Current value" field or currency picker in the editor — the price sets the value, and a typed amount would be overwritten by the next refresh anyway. Instead there's a read-only line such as "= 0.041 BTC × 383,171 zł"; when you change the quantity the amount is recalculated at the last valuation price, and the next quote updates it.
After adding, a confirmation "Added: Bitcoin" appears at the bottom of the screen, and the list scrolls to the new row and briefly highlights it (with reduced motion on, the scroll is instant).
The same instrument twice. When you add Bitcoin (or an ETF with the same ticker and a number of units) and the same person already holds it, the form asks: "You already have Bitcoin — add 0.01 BTC as a purchase to the existing holding?". "Add to existing" increases that holding's quantity, value and invested capital (a holding with a transaction history gets a buy dated today), and the confirmation reads "Added to: Bitcoin". "Separate holding" adds a new row, as before. Previously a second "Bitcoin" was created silently.
An empty Portfolio shows an "Add" button in its frame. Broker import appears next to it only when the "Import" module is on.
Screen order: the balance sheet and "Add" first, then the Full-mode tools (split a contribution, broker import, income calendar). On a phone in Full mode, splitting a contribution and the import are collapsed under one "Tools" button (with a note on what's inside), because together they took about 600 px under the list; on a computer they stay expanded. The projection opens from a link in the summary card (the "Projection" module); without that module there's no link. On a phone in Simple mode the first balance-sheet item starts about halfway down the screen. On wide screens (from about 1280 px) the right-hand column with the ritual and topics stays pinned while you scroll, so no tall empty column sits next to a long balance sheet.
Table on a computer (Full mode)
On a computer with the "Investment details" module the balance sheet is a table with Name, Value, Result and Share of What we own columns. Sections and groups match the list: the "What we own" row carries the total and the combined result, each group row its subtotal and share of wealth. The name cell has two sublines: whose it is and which account ("Kuba · IKE"; a plain "Regular account" is left out, as on the list), and units with the price ("12 CSPX · 2,372 zł/CSPX"). The price always carries its unit: "383,171 zł/BTC" for crypto, "412 zł/g" for gold (the price of a gram of pure metal, also when the quantity reads "1 oz (31.1 g)"). They replace separate units and price columns that were empty for most positions. Clicking a header sorts rows within groups (amounts from the largest, names A to Z). Share is calculated against the "What we own" total in the selected view. In the "For freedom" or "At hand" view the table works like the list: "X of Y" totals, rows outside the view collapsed at the end of each group, and the combined result only from rows in the view.
In Simple mode a computer shows the balance sheet as a compact list, as on a phone, not as a grid of wide cards, so rows are easy to compare. The groups sit in two columns with even spacing; the split falls where both columns have a similar number of rows, and the order of groups doesn't change.
Details and editing (positions and assets alike)
Clicking a row opens the details. For a position that's the value history and, depending on the type, units and average price, interest, maturity or the annual IKE/IKZE limit. In a couple's plan there's a separate Owner row. Interest and the principal part of a loan instalment are shown neutrally, because they aren't a rise or fall in value. Progress toward a goal appears once, in the caption under the progress bar. The change in the history header is labelled "(incl. contributions)", because it includes your own payments; the investment result itself is the separate "Gain / loss" row. For an asset, the details show value, type, owner, the linked loan and equity on separate rows.
Details show what you can change. In Simple mode the editor has no rate of return, goal or target share fields, so the details don't show them either. They come back in Full mode (and the target share with the "Spread the contribution" module, as a "Target share 60%" row). Informational notes in the editor (crypto valued at the market rate, gold from NBP, bonds from the series engine) have a neutral background — amber is kept for warnings. The ticker sits next to the number of units ("12 CSPX") rather than on its own row.
A loan in details. The top of the sheet states the plan in one sentence, based on actual repayments (instalment + average overpayment over the last 12 entries) — the same schedule as the Dashboard, Goals and FIRE, e.g. "At the current instalment it's paid off around 2051 — in 25 years." or, with overpayments in the entries, "At your current repayments (instalment + 1000 zł/mo overpaid on average) it's paid off around 2042 — in 15.3 years.". The planned overpayment from the holding is never stated as a fact: when it's higher than the actual one, a conditional what-if follows — "With the planned overpayment of 4000 zł/mo it would be around 2034 — 445k zł less interest.". Without entries the sentence says "By the plan (instalment + 4000 zł/mo overpayment) it's paid off around …". The facts follow below. The row with the planned overpayment is labelled "Planned overpayment" ("Planned overpayment 4000 zł/mo"), because it's a plan, not overpayments actually made; the editor field now has the same name, "Planned overpayment / mo" (previously "Target overpayment"). The interest rate in the sheet has the editor's precision, e.g. "6.89%" (previously the sheet rounded to "6.9%"). Amounts in sheet rows never break mid-word: on a narrow phone the label wraps and "444,985 zł" stays on one line. The progress bar says how much has been repaid since the loan started, e.g. "Repaid 34,571 zł of 578,113 zł" (5%), and that is the only "repaid" figure in the sheet. The chart below shows just the balance over recent months ("Balance over the last 24 mo."), neutrally, with no red and no down arrow, because a shrinking debt is progress.
The "Paid off in" row uses the same actual repayments as the sentence above, with interest to the end below it. The planned overpayment has its own labelled rows: "With the planned overpayment" and "Interest saved with the planned overpayment". "Principal in the instalment / mo" is the instalment minus this month's interest; actual overpayments (the average from entries) have their own row, so together they match the balance drop in the history. We treat the term as the original contract term, counted from the start of the loan (the opening date, otherwise the loan's first month in the history). When the instalment pays the loan off later than the contract ends, the plan sentence states both dates: "The contract ends in 2046; at the entered instalment it takes until 2051 — check the instalment." When the start of the contract is unknown, a shorter hint appears under the plan: "The installment doesn't fit the 25 years term — check the installment or the interest rate." It's usually a typo in one of those fields, so the loan editor now has Term (years) under "Basics", next to the instalment, not in the collapsed "More settings". The old "Horizon" and description fields from the spreadsheet, which can't be edited, are no longer shown for loans. When the loan is linked to an asset, the "Finances" row says what and with how much equity, e.g. "Flat · equity 56,458 zł". The method is described in Calculations.
The Edit button at the bottom opens the form in a sheet, with Save pinned in the footer. After saving, a short "Saved: name" confirmation appears at the bottom of the screen. After deleting a position or an asset you see "Deleted: name" with an Undo button (for a few seconds). Undo brings back the same account or asset, with its value history and its link to a loan.
No silent loss of changes. If you change something in the form and then tap the backdrop, press Escape or ✕, the sheet asks "Discard changes?", offering Keep editing (focused by default) or Discard changes. Without changes the sheet closes straight away.
The position form has two parts. At the top are the basic fields: name, value with currency, monthly contribution and whatever matters for the given instrument: invested capital and units for ETFs, quantity or transaction history for crypto, metal, weight and fineness for gold, series parameters for bonds, maturity date for a deposit, and for a loan the interest rate, instalment and linked asset. For ETFs and stocks the ticker sits next to the number of units, in Simple mode too, because valuation from the price depends on it. The "Number of units" field is empty, without a sample number, and the hint under it says when we'll value it from the price. In a couple's plan the basic fields also include owner and beneficiary ("whose is it" is basic information). Less frequently changed settings sit under a collapsed "More settings": account type and instrument, annual limit, rate and goal for the projection, Stooq symbol, target share, emergency fund and category (in a solo plan also the people). The section header shows a summary of what's inside (e.g. "IKE · Retirement").
Below the form are "Withdraw / sell" and "Delete". They mean different things:
- "Withdraw / sell" — the account really existed and you sold, withdrew or closed it. Its history (chart, contributions, monthly changes) stays.
- "Delete" — the position never belonged in the plan (a mistake, a test, a duplicate). It disappears together with its history: from monthly snapshots, from each month's net worth and from contributions in entries. The confirmation says so. Previously the history stayed, so the deleted position showed up as a loss under "valuations and FX". Undo restores the position, its history and contributions exactly.
If a field holds an invalid value (e.g. "12,5,3" or a rate above 100%), the message appears next to that field and the cursor returns to it, even when the field is in the collapsed section (the section expands on its own).
The asset form is built the same way; its fields are described below under Assets.
Catalogue and countries
Adding from a country-dependent catalogue of instruments (switch in Settings), laid out in the balance-sheet groups. Positions (accounts, instruments, loans) and assets (things you own) are still stored separately, but when adding you don't have to think about it: each tile knows what it is. Cash lands in "Cash and other" as an asset, a flat in "Property", a mortgage in "Loans". The universal ones — ETF, stocks, funds, crypto, gold, cash, loan, "Other account / investment" and "Other thing" — are everywhere, while tax accounts depend on the market:
- 🇵🇱 Poland: IKE, IKZE, PPK, PPE, bonds (EDO/COI/OTS/ROR/ROS), deposit, savings account.
- 🇩🇪 Germany: Depot, Riester, Rürup, bAV.
- 🇬🇧 United Kingdom: ISA, LISA, Junior ISA, SIPP, GIA.
- 🇺🇸 USA: 401(k), Traditional IRA, Roth IRA, HSA, 529, brokerage.
- 🇫🇷 France: PEA, PER, assurance-vie, Livret A, CTO.
We don't translate account names (they're legal terms). In a given country you won't see other countries' accounts. Fields depend on the instrument type.
Editing a position covers: value, target contribution, goal, rate (interest / return), instalment, term, maturity date and category (which group it belongs to). You can also delete a position.
A new position's category. A position from the catalogue goes to the category its template points to (Bitcoin → Crypto, ROS/800+ and other bonds → Bonds, gold and metals → Investments). If your plan has its own category with that meaning (e.g. "Krypto" or "Kryptowaluty" created by hand), the position goes there. If there is no such category, the app adds it (named in the app's language) instead of dropping the position into the first category in the list — that's how Bitcoin used to land in "Investments" despite a "Krypto" category. Details: Data model.
In a position's details (after tapping the row) — once at least two monthly snapshots have accumulated — you'll see a mini value-over-time chart along with the change since the start of the history.
Multiple ETFs and allocation
Each ETF/stock is counted on its own — most conveniently as an instrument of an account (e.g. "XTB · Kuba" with CSPX, SWRD and free cash), and previously as a separate position — with a ticker (e.g. SWRD, CSPX) and a target allocation (%). In the category sheet (after tapping the row on the dashboard) you then see, per ETF, the current vs target allocation and drift — how far you've moved from the plan (a rebalancing hint). You enter values manually from your brokerage account (no live prices); the quotation currency is just a label — all the maths is in PLN.
Account type and instrument
In the position editor (the "More settings" section) you pick an account type (IKE, IKZE, PPK, PPE, OIPE, regular, bank/deposit) and an instrument (ETF, stocks, bonds, fund, crypto, cash). The account type is a "tax wrapper" — once you choose it, GrapeVest auto-fills the annual contribution limit and shows (for education) the tax on withdrawal and the qualified withdrawal age. You can override the limit manually. A mismatched instrument (e.g. an ETF in PPK) is flagged with a warning.
The account choice affects the net projection: IKE/PPK/PPE/OIPE tax-free, IKZE 10% on the whole amount (+ the PIT relief shown separately), a regular account 19% on gains (Belka tax). See Calculations. For IKZE, tick JDG if you file the higher limit as a sole trader.
Cryptocurrencies (native view)
A position with a crypto instrument has its own view — it shows what crypto really is, rather than treating it like a "deposit":
- Holding basics — visible always, even without the "Investment details" module (this is the foundation: without them you don't know "how much I have"): the quantity of units held in full precision (for Bitcoin also in satoshi), the price now, the average purchase price, the invested capital, and the current value and gain/loss (amount + %).
- With the Investment details module you also get analytics: a spot-price card (PLN/EUR/USD + 24h change and a mini-chart), the share of What we own, the realized result and — if you keep one — the transaction history. The share is calculated against the "What we own" total, the same as the table's "Share of What we own" column (previously the sheet divided by net worth and showed 2.1% while the table showed 1.2% for the same holding). Metals use the same base. The mini-chart is captioned with what it shows: "Price · last 24 h" or, without intraday quotes, "Holding value · 3 mo.".
Without a fresh rate the sheet shows the same price as the list row: the last known one (value ÷ quantity, e.g. "1 BTC = 383,171 zł") labelled "last known price", and when it comes from a remembered quote, with its date, e.g. "last known price · 2 Oct 2026". The cell is then called "Last known price (1 BTC)". Previously the row said "383,171 zł/BTC" and the sheet "Price temporarily unavailable · Price now —".
The quantity of units held is also shown right in the portfolio list (e.g.
0.03 BTC under the name), without opening the details.
Crypto's share of wealth. When all crypto together is more than 5% of "What we own", the details show a calm note, e.g. "Crypto is 8% of What we own. It's a volatile asset — keep an eye on its share." (the same base as the share column in the table). Below the threshold there's no note, so a permanent warning doesn't teach you to ignore it.
Adding is native to the market too: instead of "deposit" fields (value, assumed return, goal) the form asks for the coin (Bitcoin/Ethereum directly; the generic "Crypto" template offers a picker), a quantity or the amount you paid — the missing value is derived from the live rate (e.g. 4,000 zł ÷ BTC rate = quantity). The purchase amount becomes the position's invested capital, so gain/loss is tracked from day one. There are no "assumed return" or "goal" fields for crypto — the valuation follows the market, not a forecast. The quantity field carries the coin's unit: "Quantity (BTC)", "Quantity (ETH)"; with no coin picked, "Quantity (units)".
Adding without a rate (offline). A position no longer gets a value of 0 and invested capital of 0. When the rate is unavailable, GrapeVest values the quantity at the last known price of that coin in your portfolio (value ÷ quantity of an existing row, e.g. 15,710 zł ÷ 0.041 BTC = 383,171 zł/BTC), and the invested capital is that valuation or the purchase amount you entered. The note under the fields says which price will be used: with a fresh rate "1 BTC = …", with an older remembered quote "We'll value it at the price from 2 Oct 2026: 383,171 zł/BTC", with a price from your portfolio "No fresh price — we'll use the last known one: 383,171 zł/BTC", and with no price at all "No price yet — we'll value it at the first price we get". Previously it promised the "live rate" even offline. With no price at all, a quantity alone isn't enough: saving asks "Without a price we don't know the value — enter the amount you paid." (for metals: "the purchase price"). Previously such a holding entered the totals as 0 zł. A coin outside the catalogue ("Other") has no live price — its value is the amount you paid. A holding without invested capital (e.g. from an import) keeps it unknown: the details show "— purchase amount missing" instead of a green "▲ +0 zł", and the first fresh rate sets the invested capital to the value it produces. That way the whole value isn't counted as gain. Gold and other metals (last known price per gram) and ETFs added with a number of units work the same way. An invested amount you entered yourself is never changed by a rate.
In the editor, enter the quantity and the symbol in the Ticker field (e.g.
BTC, ETH). Once it recognizes the symbol, GrapeVest fetches the current rate
from CoinGecko and recalculates the position's value (quantity × rate). Without a
network connection it uses the last known/entered value. Details and privacy:
Calculations.
A position with no quantity entered. If a crypto position has a value and
capital but never received a quantity (e.g. contributions recorded without access
to the rate), the app no longer shows the misleading "0 BTC ≈ 0 sats": the quantity
is computed as value ÷ rate and marked with a ≈ sign. On the first run with
access to the rate, this computed quantity is saved into the position (a one-off
self-fill) — from then on the valuation follows the market just like a manually
entered quantity.
With the Investment details module, the editor gains a transaction history — you add successive buys/sells (date, quantity, price/unit). Then the quantity, the average price (weighted) and the realized result are calculated from transactions rather than from a manually entered quantity. After picking a date, an empty price field fills in with the coin's rate for that month (live for the current month, archive for past ones) — you can override it. Besides buy/sell there is also a Reward (staking/airdrop) type: it adds units with a cost basis of 0 zł (Polish tax practice), lowering the average purchase price. After opening the Crypto category, a bar of current rates for the coins you hold appears at the top (price + 24h change) — without opening a position.
ETFs and stocks (units + rate, like crypto)
ETFs and stocks work the same way as crypto: in the editor you enter the number
of units, and optionally a Stooq symbol (e.g. cspx.uk) for a live rate.
Once you provide the symbol, GrapeVest fetches the quote from Stooq (free, no
key) and converts it to PLN at the NBP rate, so the details show: how many units
you have, the price now, the average purchase price and the result. The
number of units is also shown right in the portfolio list (e.g. 12 SWRD).
Mapping from a bare ticker can be unreliable (Xetra/LSE), so we fetch the rate only
when you provide a Stooq symbol or a ticker with a market suffix (e.g.
cspx.uk). Without that — or without a network connection — the value stays
manual (nothing is zeroed out). It's an enrichment, not a dependency.
The same path now works when adding: the ETF/stocks form has optional
ticker, number of units and purchase amount fields. When the ticker
has a market suffix and a quote is available, the starting value is computed as
units × price (in the currency from the selector, converted at the NBP rate),
and the purchase amount becomes the invested capital. Without a ticker the form
works classically (manual value).
The ticker field has a search box: start typing a name, ticker or ISIN (e.g. "S&P 500", "VWCE") and suggestions from a built-in catalog of popular ETFs and stocks (UCITS, WSE, US) will set the Stooq symbol, quote currency and position name for you. The catalog is local (no network) — any ticker can still be typed manually.
Gold and precious metals (weight × fineness × price)
The Gold / metals template is no longer a "deposit with an assumed 4% rate" — when adding, you enter what you actually hold:
- the metal — gold, silver, platinum or palladium,
- the weight in grams (raw weight of the item),
- the fineness — from a list of common finenesses with their karat equivalent (999.9 = 24 kt bars and bullion coins; 585 = 14 kt jewellery, and so on),
- the purchase price — it becomes the invested capital (gain/loss is measured against it).
Instead of typing the weight you can pick a product from the bullion catalog (1 g–100 g bars, Krugerrand, American Eagle, Maple Leaf, Vienna Philharmonic…) — the weight and fineness fill in automatically. The catalog knows the 22-karat subtlety: a Krugerrand weighs 33.93 g gross but contains exactly ~1 troy oz of pure gold. With a purchase price entered, the form also shows the premium over melt value (the dealer's margin) — informational only; the position is always valued at melt.
From that GrapeVest computes the grams of pure metal (weight × fineness/1000)
and values them live: gold at the NBP price (the official price of 1 g of
1000-fineness gold, published once per business day), and silver, platinum and
palladium from the Stooq spot (USD per troy ounce, converted at the NBP rate
into zł/g). The position's value refreshes on app start, just like crypto and
foreign currencies; offline nothing is zeroed (the last valuation stays).
The position details show the weight and fineness, pure grams, the NBP
price per 1 g (with its publication date), the purchase price and the
gain/loss; the portfolio list shows the pure grams under the name with one decimal (e.g.
31.1 g), and whole troy ounces the human way: "1 oz (31.1 g)".
There are no "assumed return" or "goal" fields for metals — the projection keeps
the value flat (we don't guess how much gold will grow).
Tax on selling metal (Poland). Selling coins and bars more than six months after the end of the month of purchase is not a source of income for Polish PIT (art. 10(1)(8)(d) of the PIT Act), so no tax is due. That's why a metal shows a "tax-free after 6 months" badge instead of "19% on gains", and the projection doesn't deduct tax from it (projection horizons are at least 2 years). An earlier sale is taxed on the PIT scale, not the 19% capital-gains tax. Investment gold is also VAT-exempt at purchase (art. 122 of the VAT Act); that concerns the purchase price, not the valuation. Outside Poland the rules depend on the country and the holding period, so the badge neutrally says "tax depends on holding period" and the projection stays conservative.
Buying gold monthly? A contribution to a gold position in the
monthly entry settles in grams, like crypto:
grams = amount ÷ that month's NBP price (past months come from the NBP
archive). The purchase is recorded in the position's history, so the quantity,
average purchase price and result stay consistent; re-saving a month overwrites
the purchase instead of duplicating it.
Retail treasury bonds (per series)
The EDO / COI / TOS / OTS / ROR / ROS templates are no longer a "deposit with a fixed rate". When adding you enter: the number of bonds (units × 100 zł), the purchase date, the first-period rate from the issue letter and — for indexed types — the margin over inflation. The bond engine computes the value:
- year 1 at the issue rate, years 2+ = CPI (GUS) + margin (deflation → margin only),
- EDO/TOS/ROS/ROD: annual capitalization; COI: yearly interest payout; ROR/DOR: monthly payout (payouts are cash in your pocket, not position growth),
- between events interest accrues linearly by days — the value grows daily, like in the issuer's interest tables.
The position details show: the current-period rate (with the period number), accrued interest, interest paid out, the next event (capitalization / payout / redemption) and the fee if redeemed today (per-unit fee by series, never more than accrued interest). In the editor ("Investment details" module) you can adjust the assumed inflation for months not yet in the GUS table and the early-redemption fee.
Bond positions are skipped in the monthly entry — buying more in another month is a different series (different first-period rate), so you add it as a new position from the catalog. Simplification: ROR/DOR use the purchase rate (the NBP reference rate has no free browser-friendly feed).
Upcoming income (calendar)
Below the balance sheet (when there is something to show) a card "Upcoming income (12 mo)" appears: COI/ROR interest payouts, bond redemptions with the redemption amount, and maturities of deposits and other positions with a redemption date — sorted by date, with a total.
Spread the contribution (rebalancing without selling)
When you set target shares (%) on positions, the Spread the contribution card (below the balance sheet) immediately shows the share of strategy: for each position the name on the first line, and on the second a bar with "now → target" (e.g. "28% → 50%") and an above target / below target label when the deviation is at least 2 pp. So you see where the portfolio has drifted before you enter an amount. Share of strategy counts only positions with a target, so it can differ from the "Share of What we own" column in the table (which divides by the "What we own" total). Once you enter an amount, GrapeVest suggests how much to add to each position to bring the portfolio closer to the strategy, starting where the share is below target. The suggested amounts are neutral (a hint, not a rise in value). This is rebalancing through top-ups, without selling (zero taxable events). The suggestions respect each person's annual IKE/IKZE limits: if an account is close to its limit, the surplus goes where it fits (the position gets an "account limit" badge), and any unallocated remainder is shown explicitly. Without target shares set, the card doesn't appear.
Import from your broker
Below the balance sheet (the "Import" module) there's a prominent "Import from your broker" card. A wizard guides you step by step: pick a broker, upload an export (CSV/XLSX) or paste data, and GrapeVest recognizes the format, matches tickers/exchanges and creates positions in your base currency. Recognized automatically: XTB, Trading 212, Interactive Brokers and DEGIRO. mBank eMakler (the parser is waiting for a real sample file) and the rest (PKO, ING, BOŚ/bossa, Alior, Santander, Revolut and others) go through the CSV wizard with guided manual column mapping. The import card in the Portfolio says the same. Everything happens on your device (E2E). Full guide: Import from your broker.
Owner and "for whose goal"
You can assign each position and asset an owner (one of the two managing
accounts, or "joint") and a beneficiary ("for whose goal" — e.g. a child, or
"none"). The owner drives the people switcher on the Dashboard; the
beneficiary drives the "For {child}" summary (wealth set aside for that person's
goal, regardless of who formally owns it).
Accounts with several instruments
When one account holds several instruments — a broker with ETFs, an IKE, an account with stocks (Microsoft, Meta, Amazon), a crypto exchange with BTC and ETH — create an account. Each instrument is then counted on its own (units × price), the account has free cash, and changes are recorded as operations (buy, sell, switch, deposit, withdrawal, dividend, interest, fee) — in the monthly entry or as they happen from the Dashboard.
The "Accounts" section in the Balance tab:
- "New account" — a name (e.g. "XTB · Kuba"), institution, type (Brokerage account, IKE, IKZE, Crypto exchange) and — in a couple — whose account it is. IKE/IKZE gets an annual contribution limit; deposits to the account count toward it.
- The account list — name, first instruments, value. Tapping opens the account view: value and gain above what was paid in, the instruments' shares (a bar with a legend), instruments (units, average price, value, gain), free cash, realised this year (result from sales: securities by FIFO as in PIT-38, crypto — pooled costs) and the operation history (tap to edit). Actions: Add operation, Add instrument (one you already hold, with an opening position: units and average price — no operation), Rename, Close account (only when empty — sell and withdraw first).
- "Combine positions into an account" — positions added separately earlier (e.g. CSPX and SWRD) become one account with free cash; values don't change.
- "Split into instruments" (in an ordinary position's details) — for a lump position like "ETF investments (XTB)": enter how many units of what you hold and at what price, plus free cash. The position becomes the new account's free cash (same id — its contribution and snapshot history stays as the account's history), and the instruments get an opening position. The sheet shows the total from instruments, the value recorded so far and the difference — it goes to this month's "valuations & FX" as a correction, not a contribution. "Keep as one amount" changes nothing.
An account's instrument says "Belongs to account …" in its details, with Open account. Its units, cost and value are driven by operations — editing changes only the name and assumptions (e.g. the projection rate), and "Withdraw / sell" is an operation on the account. Broker import and rebuilding crypto units from entries skip account instruments. Deleting an instrument also deletes its operations (no "ghost" purchases left in the cash); free cash is removed only together with the account. A closed account shows in closed accounts as a whole — "Restore" brings it back with all its instruments.
A goal counted "from a source" that was a lump position later split keeps counting the whole account (instruments + free cash), not just the free cash.
An instrument sold down to zero disappears from the lists (account, monthly entry, balance sheet). Its result stays under "Realised in the year" and its operations stay in the account history. An instrument added before its first purchase (0 units, no operations) stays visible so you can buy it.
Free cash in other currencies
Part of the cash at a broker can sit in dollars or euros — for example after selling a USD-listed ETF on XTB. The operation sheet then shows "Free cash in: PLN · USD":
The position's earlier contributions and withdrawals become account operations (deposit / withdrawal dated in their month, with the person), and the free cash stays as you entered it; previously that history lived only in entries and was lost on the first cloud merge.
- buy and sell of an instrument listed in a foreign currency: pick USD and the purchase takes dollars (units × price), the sale adds them. The exchange rate is under "Commission and exchange rate";
- deposit, withdrawal, dividend, interest, fee, tax: pick the currency, enter the amount in that currency and the rate (NBP suggestion). The złoty equivalent shows under the field.
The first operation in a currency creates a "Free cash USD" position in the account. It's listed with the balance in the currency and its PLN equivalent. The PLN value is refreshed at the current NBP rate, like other foreign-currency positions. A USD deposit counts as that month's contribution in złoty, at the rate from the operation. The commission is entered in złoty and, for a dollar operation, converted at that operation's rate.
PIT-38 for the year (estimate)
Once something has been sold in an ordinary account (not IKE, IKZE or PPK), a "PIT-38 for 2026" row with the estimated tax appears under the account list. The sheet shows the two parts of the return, plus a year picker when sales happened in several years:
- Securities: revenue (gross sales), costs (FIFO cost including the purchase commission + the sale commission), income or loss, and 19% tax;
- Crypto-assets: revenue, costs incurred in the year, excess costs from previous years, income, excess carried to next year, and tax. Swapping one coin for another isn't a sale.
It's an estimate from the operations recorded in the app. Securities losses from earlier years and foreign dividends aren't included, and your broker's PIT-8C is what counts. Details in calculations.
Withdrawals, sales, redemptions
Editing an investment position (row → details → Edit) has a "Withdraw / sell" button. You enter an amount (or tick "whole position" — a full redemption); for a foreign-currency position you enter the amount in its currency, with a PLN-equivalent preview.
The position's value drops by that amount, and its cost basis (used for gain) is reduced proportionally. With "Add to cash" (on by default) the withdrawn amount moves to a "Cash" asset (created if none exists) — net worth doesn't change. It's an intuitive way to sell crypto, redeem bonds early, or take money out of an account.
Money spent (without "Add to cash"). Then it's a regular withdrawal for the month: we record it in the current month's entry with the same logic as the monthly entry — living costs grow by it and the change breakdown shows it as a withdrawal, not a market loss. A second withdrawal from the same account in the month adds up. If there's no entry yet, one is created without income — fill in the rest in the monthly entry, where the withdrawal already sits in its field (and isn't subtracted twice). Whole position without cash closes the account (instead of deleting it), so it can be restored.
Closed accounts
An account closed in the monthly entry ("Close account — everything withdrawn") or by withdrawing the whole position without cash goes to a "Closed accounts" section at the bottom of the Balance tab, with the month it was closed ("closed: July 2026"). Closed accounts don't count toward net worth, projections, the monthly plan or FIRE, but their history stays: names in History, snapshots, contributions and withdrawals from past months. "Restore" undoes the closure when it was a mistake: the account returns with its value from the moment it was closed, and that month's entry stops closing it (the withdrawal stays — it happened).
Assets: property, cash, things
Real estate, land, cash, vehicles, equipment and collections sit in the balance sheet next to accounts (the "Property" and "Cash and other" groups) and are edited just like positions: row, details, Edit. The asset editor has the same layout as the position editor: name, value with currency and one class-specific field at the top; class, growth or depreciation, linked loan, note, emergency fund and people sit under "More settings". Each asset has a class (cash / real estate / physical), and the editor shows the fields appropriate for the class:
- Cash — where it's kept (account / savings / deposit / at home / currency), emergency fund.
- Real estate — how it's used (primary / rental / land) and growth %/year (a low default — without assuming 8%).
- Physical (car, equipment, collection) — depreciation %/year (value drops in the projection; collections flat). No ticker or rate of return.
You can link an asset to a loan (car ↔ lease, house ↔ mortgage) — the row then shows "loan −… · equity …". Net worth still counts both separately; the link is for clarity. One loan finances one asset: if you pick a loan that's already linked to another asset, a note under the field says "This loan is currently linked to: Flat. Saving moves it here", and saving unlinks it from the flat, so equity is never counted twice from one loan. The loan's "Linked asset" list doesn't offer cash: a loan doesn't finance money in an account (an old link to cash, if any, stays visible so you can remove it).
You can track cash two ways: as a position in the portfolio (when you treat it as part of the plan) or as an off-portfolio asset (a plain reserve in your account).
Foreign currencies
You pick the currency right when adding a position or asset — next to the value field. The default is PLN; you can switch to USD, EUR, GBP, CHF and others.
You enter the amount in the chosen currency, and GrapeVest converts it to PLN at the current NBP rate (table A). The "≈ … zł" equivalent shows up right under the field. The rate refreshes when the app starts; each position row shows the amount in the currency and its conversion to złoty.
For example, Bitcoin bought in euros can be kept in euros, or you can simply enter its złoty equivalent. The rest of the calculations (net worth, projections, FIRE) then work in PLN.
Upcoming maturities
A list of positions with a maturity date (e.g. a bond ladder), nearest first. The date comes from the "maturity date" field (e.g. a deposit); for savings bonds added with series parameters (EDO, COI, TOS…) it's calculated from the purchase date and the length of the series, the same as in the income calendar. Bonds entered as an amount only, without a purchase date, have no maturity and aren't listed; fill in the series parameters in the editor.
Value projection
A forecast for one selected horizon ("2 years", "5 years", "10 years", "20 years" switch at the top), so the table doesn't run off sideways. The "Investments in…" card (e.g. "Investments in 10 years") sums the net values of investment positions, and under its name shows the starting point: "today …" (the investments' value today). The name says plainly that this isn't a projection of all your wealth: property, belongings and loans aren't in it, so don't compare it with the net worth in the summary card. It's deliberately calm (no brand-colour fill, smaller than net worth), because it's a forecast, not a balance. Each row has an account-type badge, its value at the horizon and the assumptions (today · rate/yr). The group's typical tax is shown once, next to its header (e.g. "Funds and stocks · 19% on gains"), and a row gets a tax badge only when it differs (e.g. IKZE and PPK among tax-free retirement accounts). Previously every row repeated the same tax. The list can be grouped (the "Group: like the balance ▾" button next to the horizon switch, in the same size) by person or account type. Net worth is calculated by account type (IKE tax-free, IKZE 10% + PIT relief separately, a regular account 19% on gains, physical metal in Poland tax-free after 6 months) — the method is described in the Calculations chapter.
The change from today is signed both ways: a rise "↑ +12,000 zł", a fall "↓ −627 zł". When the gross value doesn't fall but the net value does, that's tax on sale, not a loss — the change is then grey and labelled "(tax on sale)".
Crypto gets no growth forecast (we don't guess prices). Its row still shows the amount that goes into the total — today's value plus planned contributions — labelled "contributions, no growth" with a "volatile" badge. So "Investments in…" equals the sum of the visible rows.
Inflation. Under the total there's one sentence about what kind of money the amounts are in:
- When inflation in the FIRE settings is 0 (the default), the projection is nominal. The sentence then says what the end-of-horizon total would be worth in today's money at 3% inflation a year, e.g. "2,037,579 zł at the end of this horizon buys what about 1,516,150 zł buys today". Calculation: total ÷ 1.03^years. It's only a translation for readability; it doesn't change the projection or FIRE.
- When FIRE inflation is above 0, rates are converted to real ones and the amounts are already in today's money — the sentence says so.